
Marks and assessments
Paste the marks you already have.
A grid built for the keyboard, assessments tied to learning outcomes, and analytics that tell you who needs what.
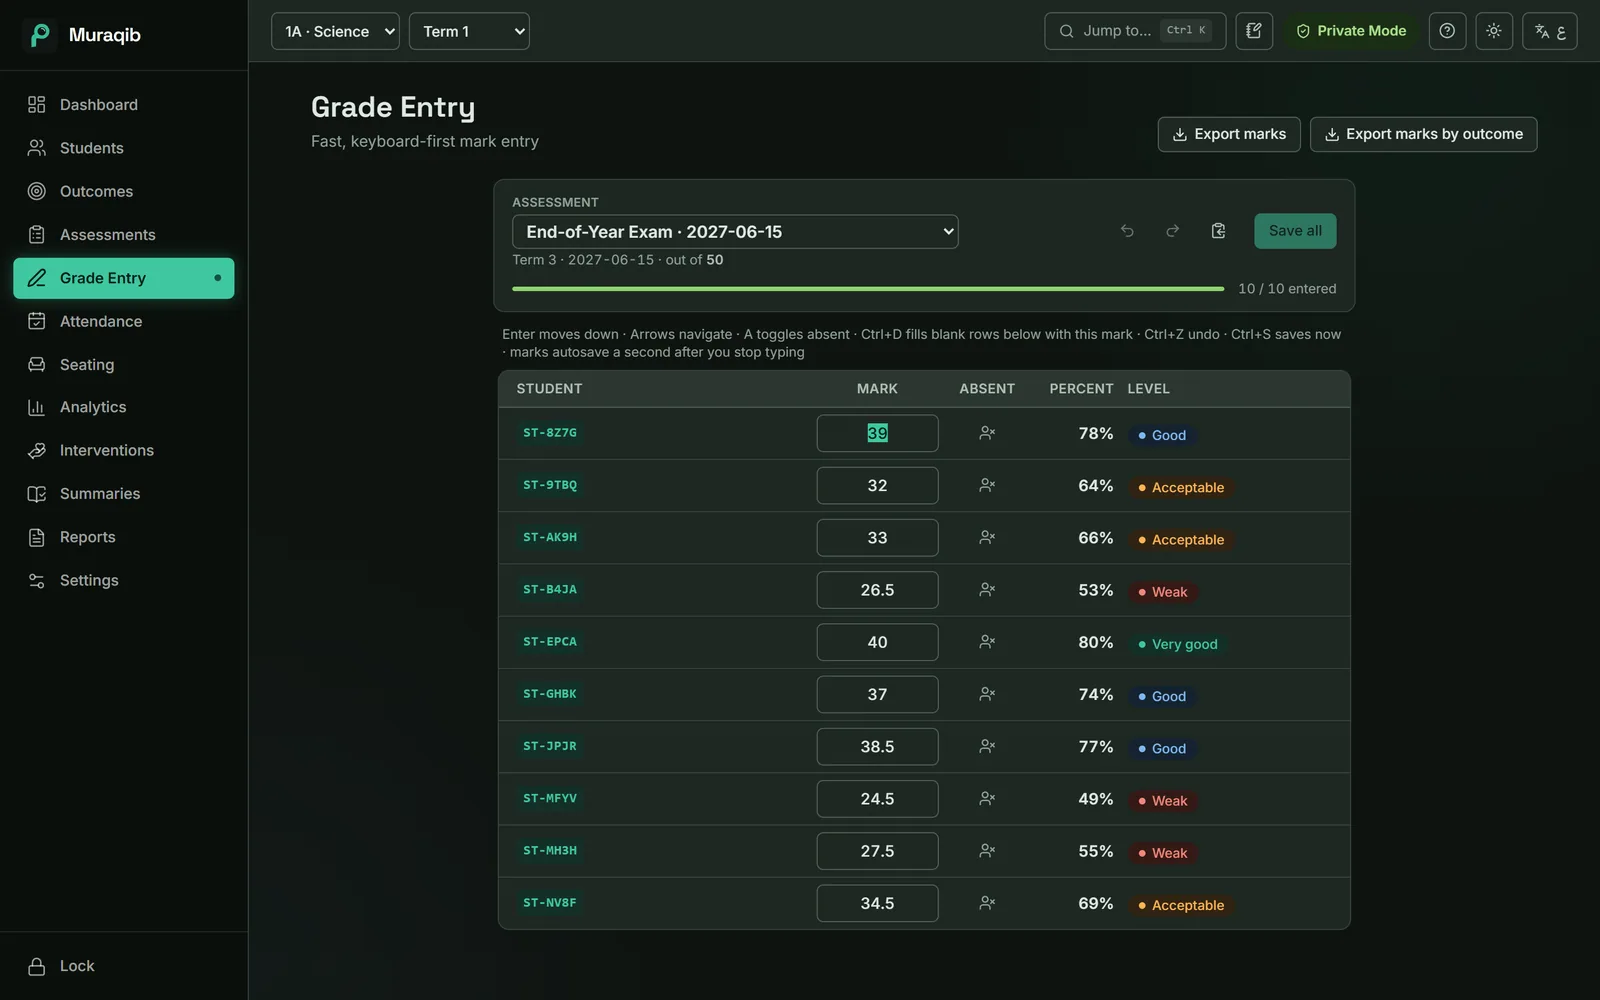
Marking is the work. Entering it shouldn't be.
The same numbers typed twice, averages worked out again, a spreadsheet per class. None of it helps a student.
How it works
Create the assessment
Pick a type, a maximum mark and the outcomes it measures. The title fills itself in.
Enter or paste
Type with the keyboard or paste a column from Excel. Percent and level update as you go.
Read the class
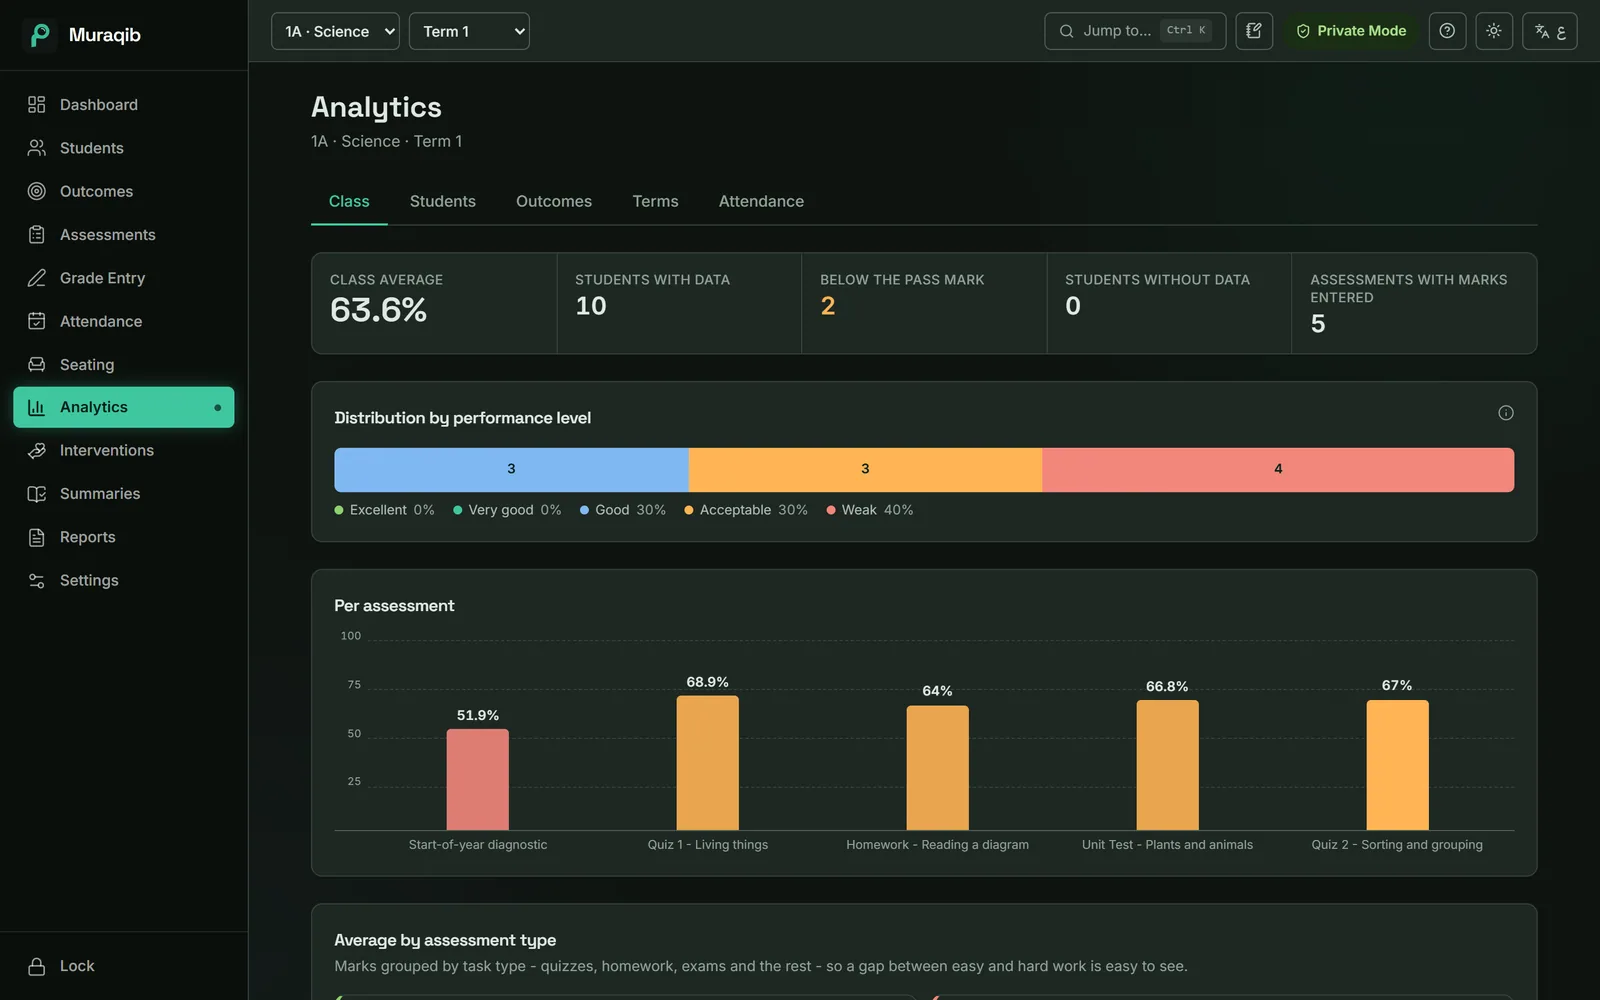
Averages, levels and outcome results update everywhere: dashboard, profiles, analytics, reports.
What you can do
- Keyboard-first grid
- Enter moves down, A marks absent, Ctrl+D fills down, Ctrl+Z undoes, Ctrl+S saves.
- Paste from Excel
- One column of marks, pasted from the student you pick, blank lines kept in place.
- Learning outcomes
- Class average per outcome, and a heatmap of who has mastered what.
- Split marks
- One assessment's mark spread across its outcomes, with the total added up for you.
- Weighting
- Equal by default; shares per assessment type when your school needs them.
- Analytics
- Level spread, per-assessment results, improved and declined, term against term.
Keep the teaching. Lose some of the admin.
Attendance, marks, observations, support and reports in one place, on your own computer.
Download Muraqib FreeWindows and Mac · Arabic and English